Since making a correction low on February 3rd, U.S. stock markets have seen a nice 5 day rally off of support and from a downside extended technical condition. My overall take is that the markets have just seen the start of a 5th wave of a sequence that started in November 2012 with a maximum upside potential of SPX 1900. I see limited upside and lots of downside potential in US equities over the next 1-4 months. The risk/reward is not very favorable for longs, particularly in comparison to the Precious Metals sector, which offered traders a very nice, high probability, low risk/high reward setup. While I have been recommending long positions in Precious Metals trading vehicles since late December 2013, I would not recommend short positions in US stocks. Longer term traders and investors would probably be better served by holding through any corrective volatility. The correction could easily take the shape of a triangle or running triangle such that deeper technical correction occurs with relatively little price correction.
All things considered, this is the wave count that fits best at this time. If we see a nice, relatively clear 5 wave count on the current move followed by a sharp down day or bearish reversal hammer day, we can be relatively certain that we have see a Wave 1 top.
When and if a new high is made, there is a strong likelihood of bearish technical divergences on the daily, weekly and monthly charts. When such bear divergences are coupled that with good arguments for a completed 5 wave sequence and a number of significant trendline breaks, risk predominates over reward. In addition, we are seeing significant turns in traditionally "risk off" markets such as Bonds and Precious Metals. While in my view these markets are still in long term bear phases, it does appear that they are in the process of correcting their initial declines and such behavior could very well correlate with a corrective period for stocks. If I were still long stocks, I'd probably exit into any new highs made over the next couple of weeks.
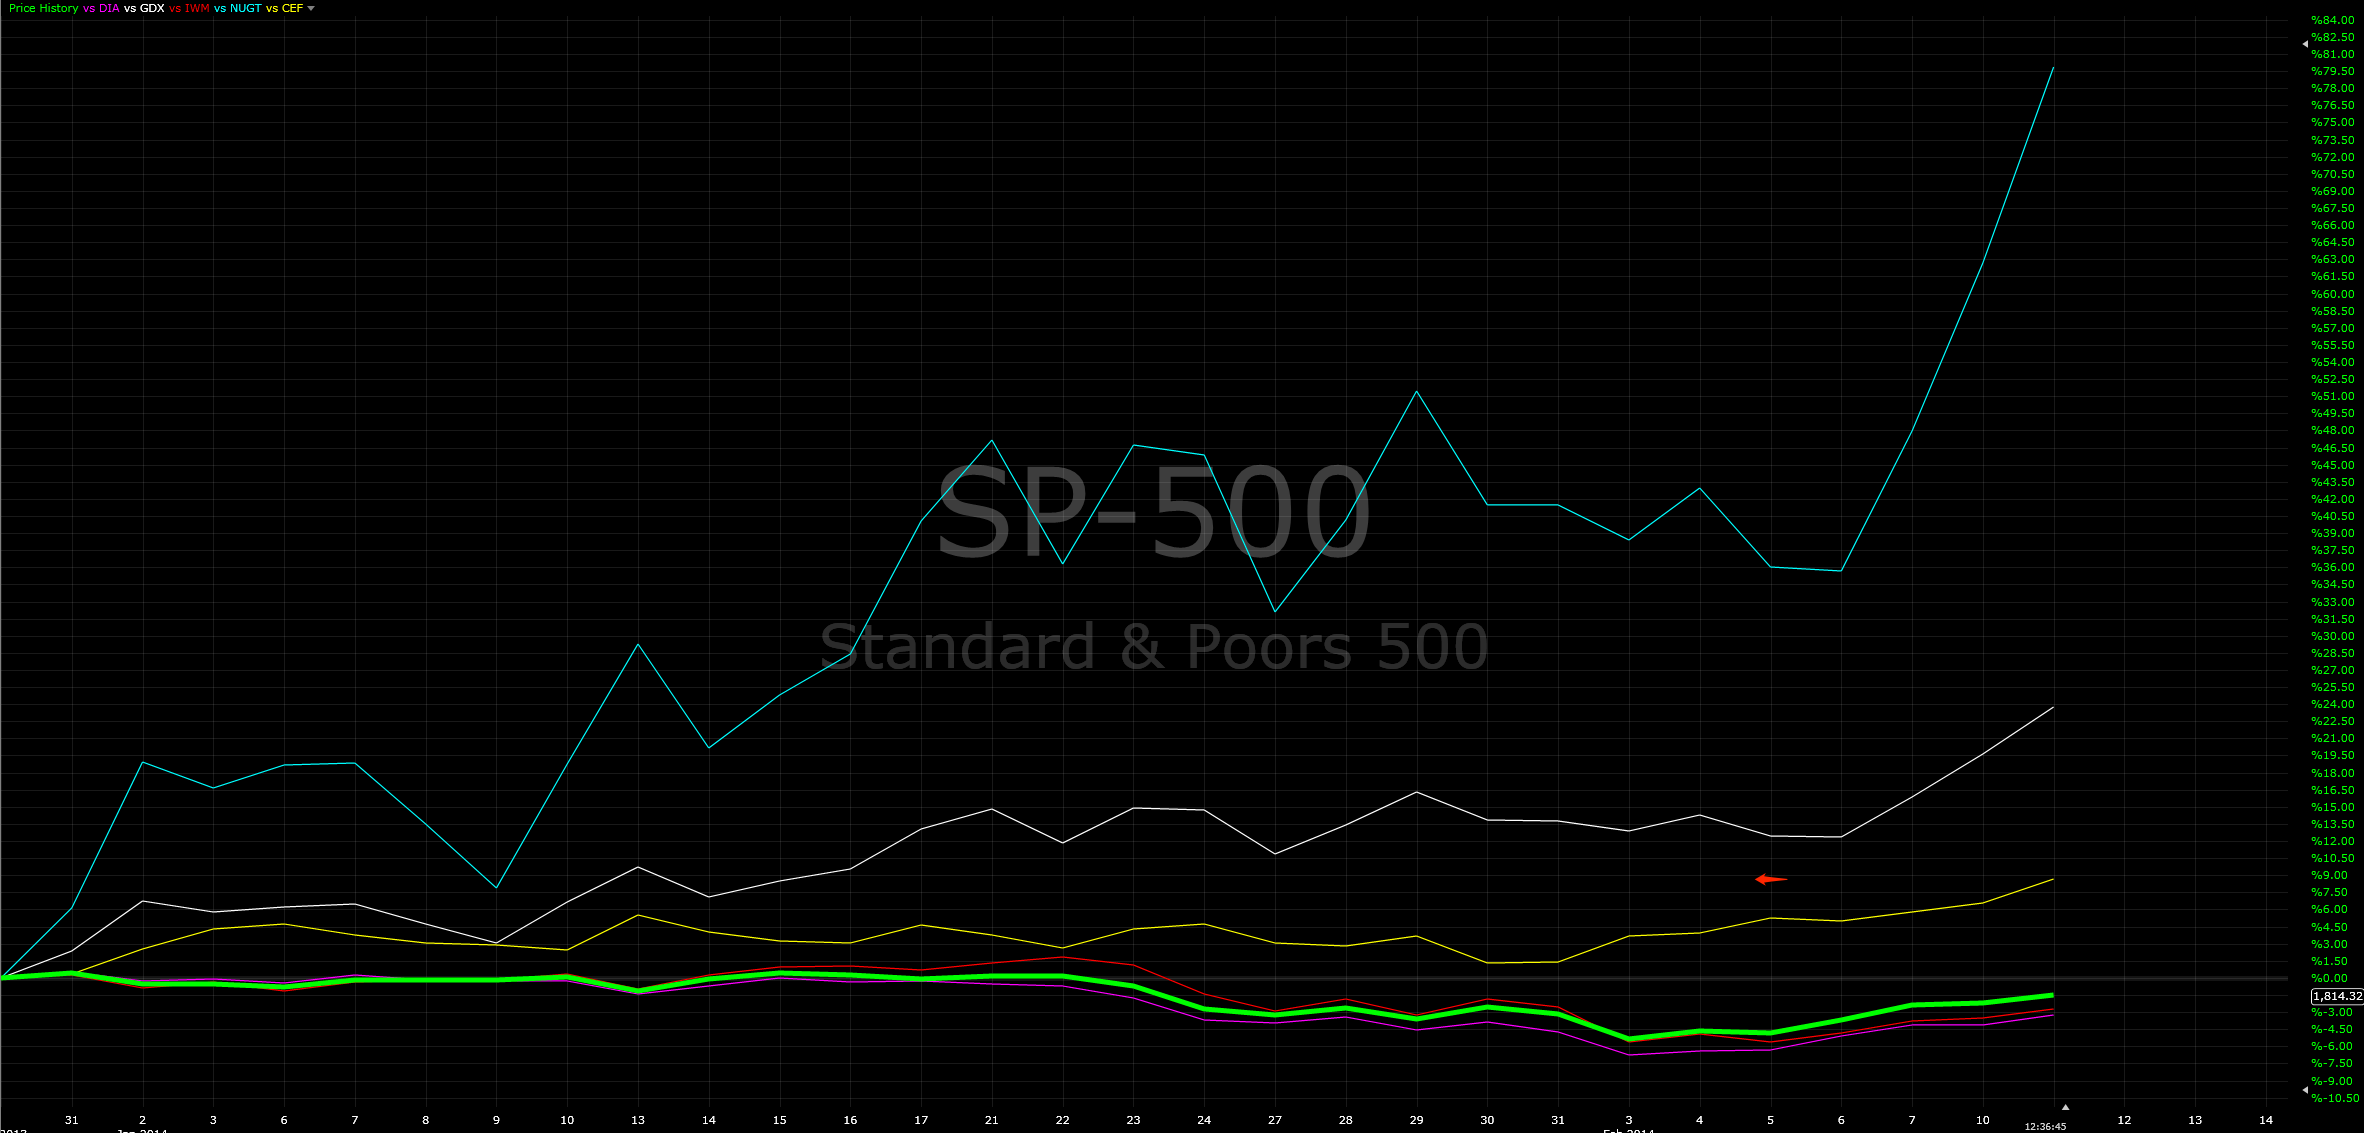
Here's a Year To Date performance comparison of SPX, CEF and NUGT. Obviously, I am very happy with my decision to rotate out of SSO and into CEF and NUGT, which I started buying at the bottom in late December 2013.
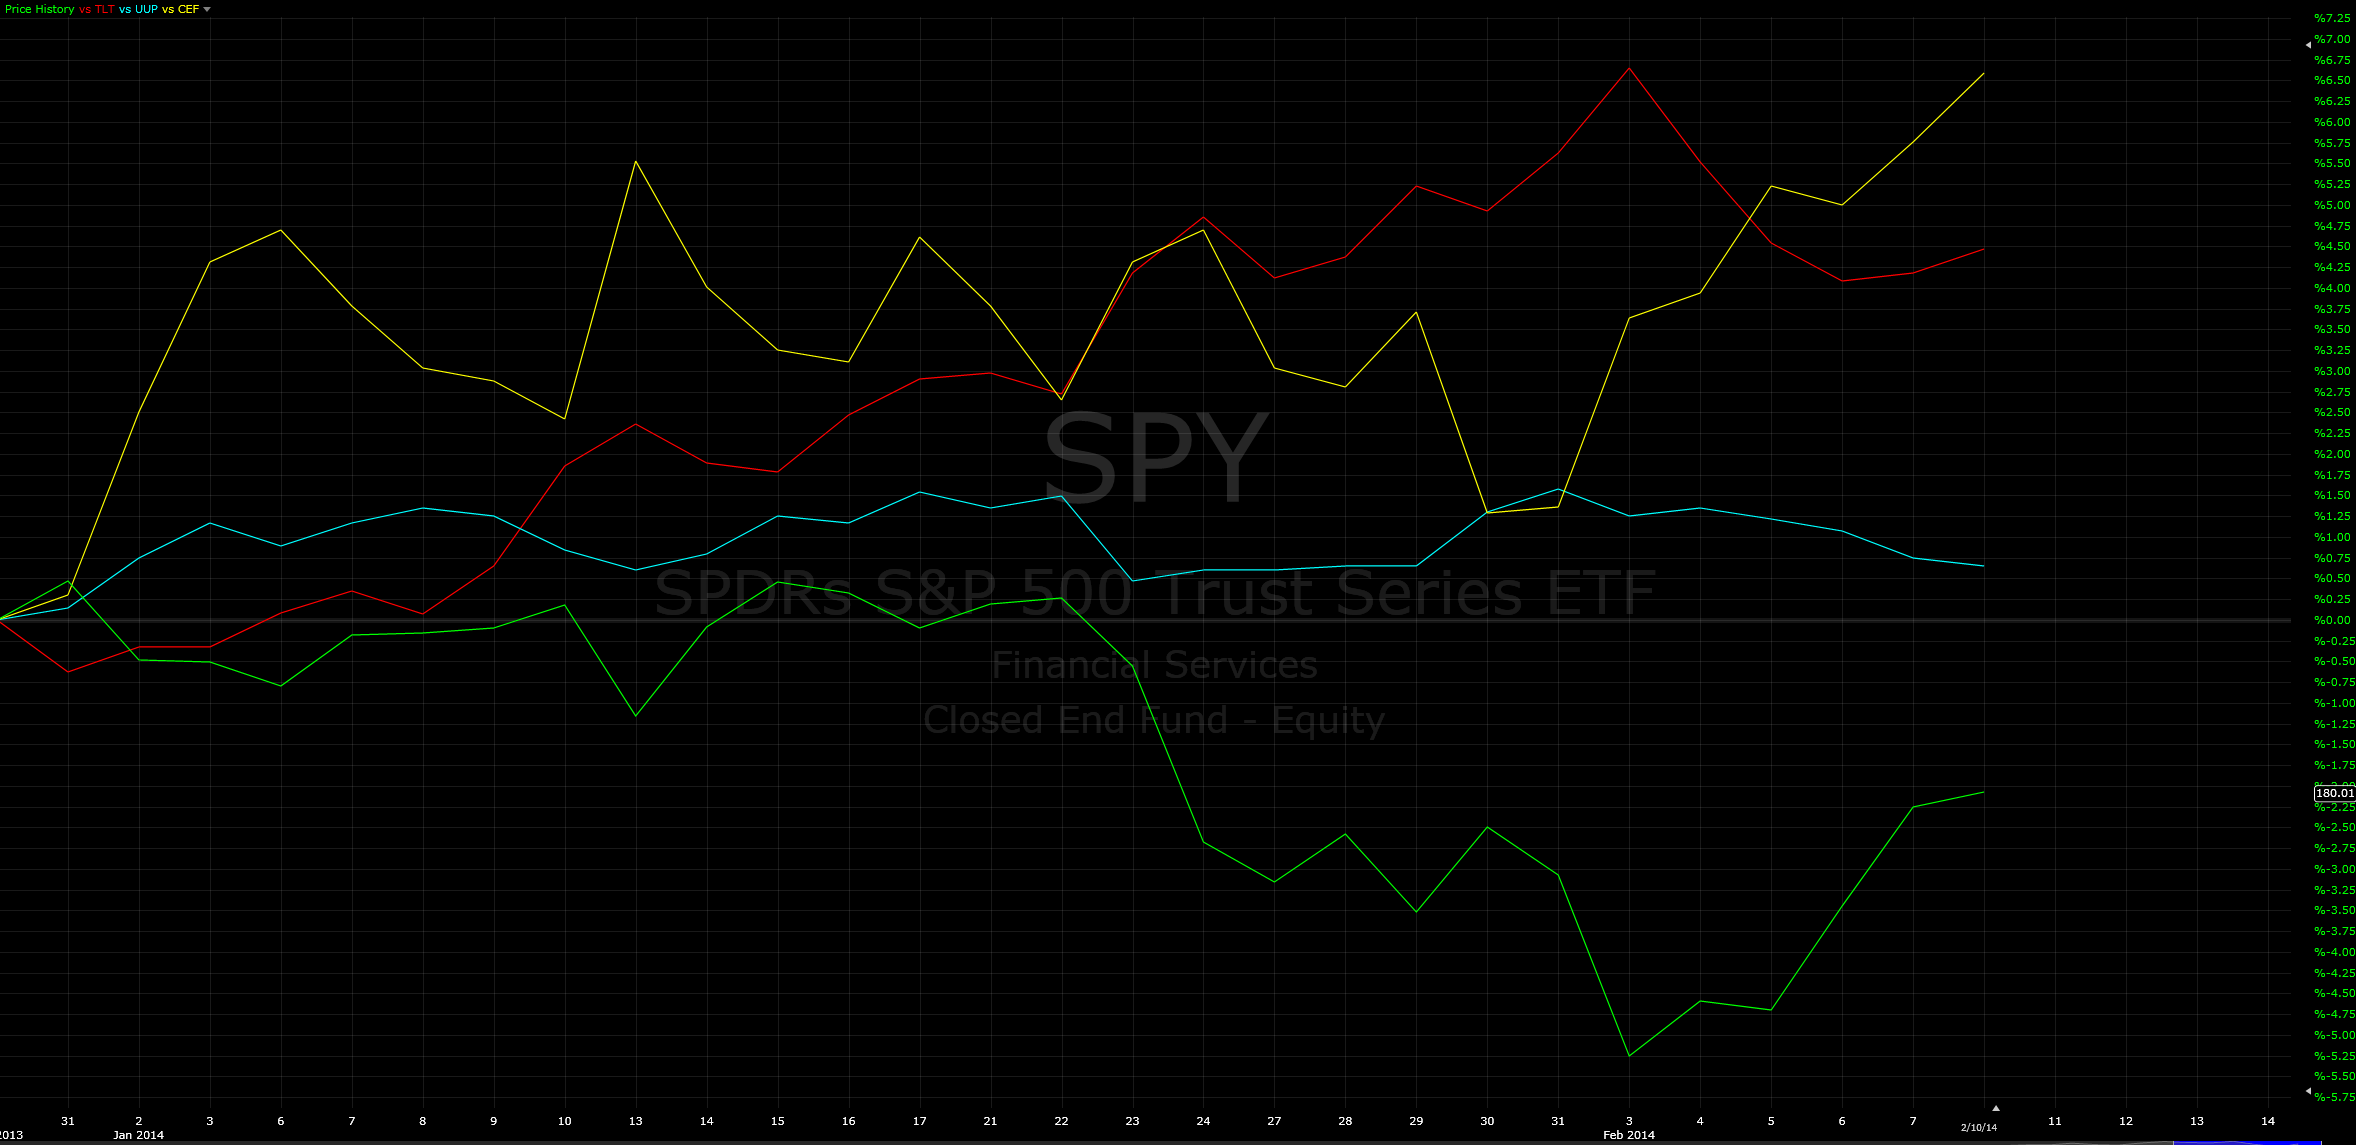
 A Year To Date comparison of major asset classes shows Treasuries and Precious Metals far outperforming SPX:
 This is most likely the beginning of a period of asset reallocation. This should prove to be a relatively brief episode, more cyclical than secular, and in the end the stocks bull market will reassert itself and the secular shift to risk will continue.
CONTINUE READING THE FULL REPORT
Need some help staying on the right side of the markets? Join the BullBear Traders room at TheBullBear.com. You'll get this kind of timely, incisive, unbiased stock and financial market trading, timing, forecasting and investment technical analysis and commentary daily. It's free to join, no credit card is required and if you like my work you just make a donation at the end of each month.
Comment
© 2024 Created by Steven Vincent.
Powered by
![]()

You need to be a member of BullBear Trading: Stock and Financial Market Technical Analysis to add comments!
Join BullBear Trading: Stock and Financial Market Technical Analysis